
toDotmat is a free-to-use, mobile-responsive data visualization tool. Much like the humble pie chart, toDotmat communicates part-of-whole relationships. However, unlike the pie chart, this tool retains the individuality of the entities e.g. people, companies, etc. in each slice.
The inspiration for toDotmat came from FiveThirtyEight.com’s "Gun Deaths in America" visual, which used a very simple yet effective visual to talk about gun deaths in the United States. The graphic answers the question: "How many people from various subsections of society killed by gun violence?" This insight could have been communicated by aggregate charts like bar charts, trellis or pie charts. However, use of aggregate visuals would have hidden away the fact that each death is a human life lost. Instead FiveThirtyEight used dots to represent each person killed. This is what makes this visualisation special.


Create Spreadsheet
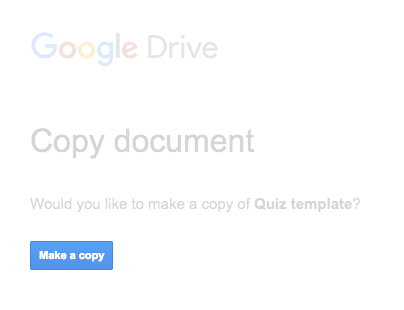
Build a new Google Spreadsheet by referring this template. Click on the "Make a copy" button to add a copy of the template to your Google Drive. The template has 4 sheets - config, narrative, filters and data. For more details, refer technical documentation.
- If you intend to publish a narrative-only story, then only include config and narrative sheets. (template)
- If you intend to publish an exploratory-only story, then only include config, filters and data sheets. (template)
- If you intend to publish video narrative, then add "mode" as video in narrative sheet. (template)
- If you intend to publish a story in Hindi language, then change the text to Hindi. Numbers remain as it is.(template)
- If you intend to publish both narrative and exploratory mode, then include all 4 sheets.
Note
Do not change the sheet names. They should still read - data, config, filters and narrative.
Do not change the column headers (first row) in the config, narrative and filters sheet. You can add your own columns in the data sheet.
Do not leave any blank rows in your spreadsheet.
Read more on what type of data to enter in the "data" sheet here.
Publish To Web
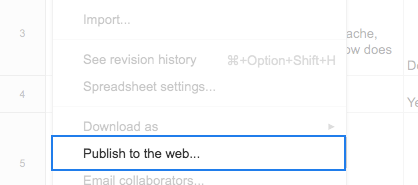
1. Under the "File" menu, select the option “Publish to the web…”.
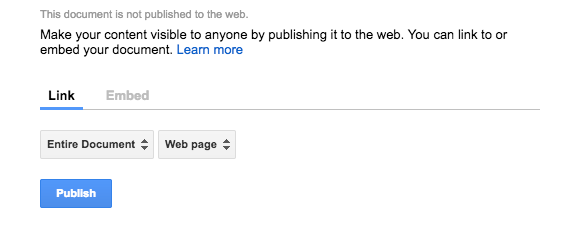
2. Click on "Publish" button without changing the default options.
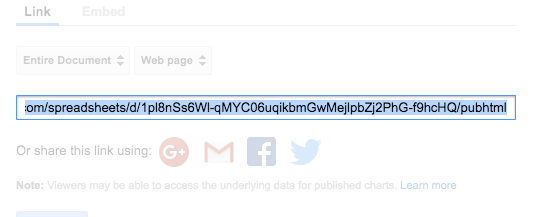
3. Copy the public link.
CMS Integration
WordPress.org: Add these plugins to allow embedding - https://wordpress.org/plugins/scripts-n-styles and https://wordpress.org/plugins/iframe
WordPress.com: Emdedding the visual on wordpress.com is not possible because it does not allow addition of iframe tags or script tags according to it's security policies.
Blogger: Full support. You can simply paste the embed code in the html section and publish it.
Medium: Not supported
Embed
Copy the code from below into a Text Editor and replace the Google Sheet URL in the text with your Google Sheet URL. Paste the embed code in your site where you want your visual to appear.
The embed code for video narrative is different from other modes. Replace the Google Sheet URL in the code below and the copy paste the embed code in your site where you want your visual to appear